Predicting hospital readmission for diabetic patients
Can routine hospital data tell which diabetic patients will be back within 30 days?
Summary
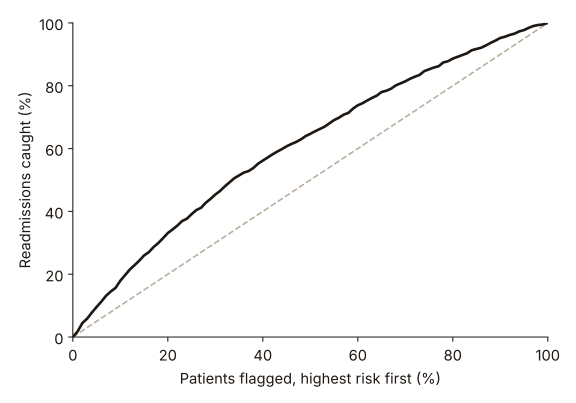
The model cannot decide on its own who will be readmitted, but it can rank patients by risk. Following up the riskiest 20% of patients would catch a third of all readmissions, about 1.7 times more than picking patients at random.
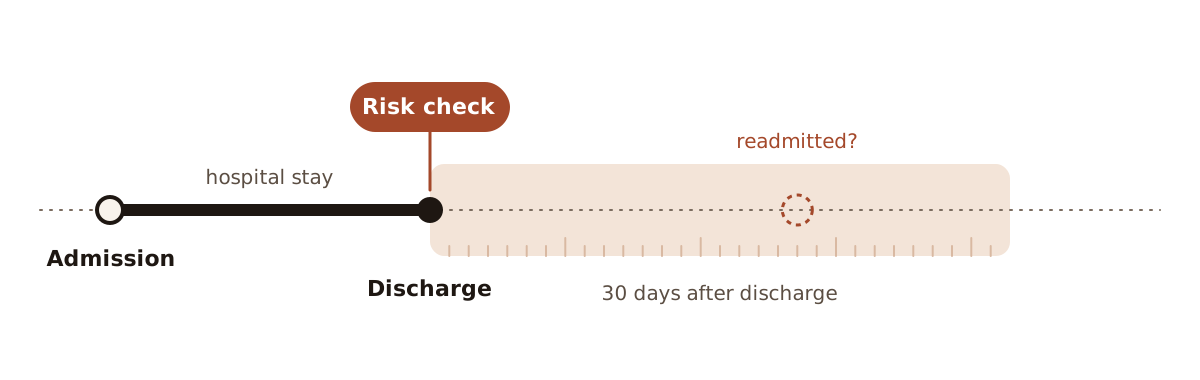
The model is meant to be used at discharge, to decide which patients need a follow-up in the next 30 days.
Key results
- 33%of readmissions caught by following up the riskiest 20% of patients
- 1.4×higher readmission rate among flagged patients than average (12.9% vs 9.1%)
- 0.62ROC-AUC on the test set: a real but weak signal
The problem
About 1 in 11 diabetic patients in this dataset (101,766 hospital stays from 130 US hospitals) is readmitted within 30 days. Readmissions are costly and often preventable, but deciding who needs extra follow-up depends on each doctor. We framed it as a binary classification task: readmitted within 30 days or not. Recall mattered most, because missing a high-risk patient is worse than an extra follow-up call.
What we did
- Cleaned the data from 101,766 stays to 67,569 patients: kept only each patient’s first stay (so the same person never appears in both training and test data) and removed patients who died, since they cannot be readmitted.
- Grouped 691 ICD-9 diagnosis codes into a handful of medical categories (circulatory, respiratory, diabetes, injury and others).
- Compared 8 models with stratified 5-fold cross-validation, undersampling the majority class to handle the imbalance.
- Ran three rounds of feature engineering and selection (for example combining visit counts into one feature, removing rarely used medications).
- Tuned gradient boosting, random forest and XGBoost with grid search.
- Afterwards, I re-ran the final model and evaluated it the way a hospital would use it: ranking patients by predicted risk.
Results
At the default threshold, the gradient boosting model reaches a recall of 0.55 and a precision of 0.13 on 13,514 test patients. A precision of 0.13 sounds low, but only 9.1% of patients are readmitted, so the patients the model flags are readmitted 1.4 times as often as average (12.9% vs 9.1%).
The model is more useful as a ranking. Following up the 10% of patients with the highest predicted risk catches 18% of all readmissions; the top 20% catches 33%, the top 30% catches 45% and the top 50% catches 65%.
| Patients followed up | Readmissions caught |
|---|---|
| Top 10% | 18% |
| Top 20% | 33% |
| Top 30% | 45% |
| Top 50% | 65% |
What I learned
- Optimizing for one metric can produce a useless model. Tuning XGBoost only for recall made it predict that everyone would be readmitted: perfect recall, precision equal to the base rate (9.1%).
- A weak model can still be useful if you use it the right way. As a yes/no classifier it is poor, but as a risk ranking it helps target follow-ups.
- Check that the code does what the description says. Our preprocessing was meant to drop columns with more than 95% missing values, but it dropped columns with more than 5% missing. That removed HbA1c test results, which are probably relevant for diabetes; fixing this is the first thing I would try next.